
CAPA effectiveness is central to product quality, patient safety, and regulatory compliance in life sciences. The right mix of metrics, including CAPA effectiveness rate, recurrence rate, average time to closure, on-time closure rate, backlog, root cause analysis quality, and cost of poor quality, provides leaders with actionable visibility. By utilizing clear KPIs, risk-based verification, integrated digital workflows, and effective management governance, pharmaceutical companies can transform CAPA from a compliance checklist into a strategic quality improvement engine that reduces repeat issues, lowers remediation costs, and enhances inspection outcomes. Key industry data shows CAPA-related findings remain a major inspection risk, the cost of poor quality can be material to revenue, and best-practice targets (e.g., >90% CAPA effectiveness) are achievable when systems, people, and measurement align.
Why CAPA Metrics Matter?
Corrective and Preventive Action (CAPA) sits at the heart of a life sciences quality system. CAPA turns problems into improvement opportunities. For manufacturing leaders, quality heads, compliance officers, and continuous improvement teams, measuring CAPA effectiveness is not optional. Good metrics show whether root causes were found and fixed, whether actions prevented recurrence, and whether the system is inspection-ready. They also clarify where resources should be focused to reduce risk and cost. Here is a practical framework that includes current industry data, recommended KPIs, measurement approaches, verification guidance, governance and tooling strategies, and a sample KPI dashboard and chart you can adapt immediately.
What “CAPA Effectiveness” Actually Means
CAPA effectiveness means that corrective or preventive actions materially reduce or eliminate the recurrence of the root problem and any related risks. Effectiveness is not a checkbox: it is a measurable change in outcomes. In practice, effectiveness has three dimensions: outcome (no recurrence), timeliness (actions and verification done within risk-appropriate windows), and robustness (root cause analysis and controls are sound and sustained). Regulators evaluate CAPA systems by looking for evidence that organizations compare analyses across data sources, use appropriate statistical or trend methods, and have clear verification steps.
Five Load-Bearing Metrics Every Pharma Leader Should Track
CAPA Effectiveness Rate (percent verified effective)
Definition: Percentage of CAPAs that pass effectiveness verification after implementation and monitoring. Why it matters: This is the closest single metric to the question “Do our CAPAs actually work?” Targets and interpretation: Best-practice organizations target >90% effectiveness; lower rates suggest weak root cause analysis, incomplete actions, or poor verification methods. Track by risk category (high/medium/low).
Recurrence Rate (percent of issues that reappear)
Definition: Percentage of closed CAPAs that have a documented recurrence (same issue, similar root cause) within a defined window (commonly 6–12 months). Why it matters: Recurrence is a direct signal that the CAPA failed to control the source of the problem. Benchmarks: industry pilot studies show baseline repeat rates around mid-teens (e.g., ~16% in some device sector baselines), and rigorous pilots have reduced repeats to under 1% with focused interventions. Use the recurrence rate by CAPA type and process owner to find hotspot areas.
Medical Device Innovation Consortium
Average Time to Closure (days)
Definition: Median or mean number of days from CAPA initiation to final closure after successful effectiveness verification. Why it matters: Long closure times increase the window for recurrence, raise remediation costs, and indicate process bottlenecks. Context: There is no universal regulatory timeline, but many organizations use risk-based targets (for example, certain immediate safety CAPAs might be a few days, while complex systemic investigations may span months). Avoid arbitrary rules that drive corner-cutting.
On-time Closure Rate (percent closed by assigned due date)
Definition: Percentage of CAPAs closed by their agreed due date. Why it matters: On-time closure combines planning discipline with execution quality. Poor on-time rates often correlate with insufficient resourcing, weak project management, or inadequate governance. Monitor overdue CAPAs by aging buckets and root cause owner.
CAPA Backlog and Aging (count and distribution)
Definition: Number of open CAPAs and their age distribution (0–30d, 31–90d, 91–180d, >180d). Why it matters: Backlog inflates operational risk and invites regulatory scrutiny. A backlog skewed toward older CAPAs may hide ineffective prioritization or stalled investigations.
Complementary Metrics (must-have to explain root cause quality and impact)
Root Cause Quality Score (qualitative rubric converted to a score)
Definition: A scored assessment (0–5 or 0–10) of whether the root cause analysis is logical, evidence-based, identifies systemic causes, and links to appropriate corrective and preventive actions. Why it matters: Poor root cause work is the top reason CAPAs fail; a scoring system helps measurement and continuous improvement.
Prevention vs Correction Ratio
Definition: Ratio of preventive CAPAs (actions taken to stop potential problems) to corrective CAPAs (actions taken after issues). Why it matters: A mature system invests in prevention; a skew toward correction can indicate a reactive culture.
Cost of Poor Quality (CoPQ) is tied to CAPA.
Definition: Direct and indirect costs attributable to issues addressed by CAPAs (rework, scrap, investigation labor, product holds, remediation). Why it matters: Translating CAPA performance into a financial lens enables executive prioritization. Industry references commonly place CoPQ in the order of low double-digit percent of revenue for many manufacturers. Quantifying savings from effective CAPA closes the loop to ROI.
Inspection and Regulatory Signals (Form 483s, Warning Letters linked to CAPA)
Definition: Number (or percent) of regulatory findings that relate to CAPA deficiencies, and trends over time. Why it matters: CAPA issues are a frequent inspection focus and cause of recurring Form 483 observations. Use this metric to link CAPA performance to compliance risk.
How to Define KPIs So They Drive Correct Behavior (not gaming)
Set KPIs that measure outcomes, not activity. For example, “percentage of CAPAs with documented root cause evidence and successful verification” is better than “number of CAPAs closed.” Use SMART criteria (specific, measurable, achievable, relevant, time-bound), and calibrate targets by risk. Next, ensure KPIs are segmented: by product line, site, process, risk, and CAPA category. Finally, pair KPIs with control limits and escalation rules; if recurrence or overdue CAPAs cross a threshold, an automatic governance review should trigger.
Designing a CAPA Effectiveness Verification Plan
Verification is where many organizations fail. A robust verification plan includes:
• Pre-defined success criteria: What does “effective” mean for this CAPA? Quantitative thresholds where possible (e.g., 0% recurrence over 6 months, or a reduction in defect rate by X%).
• Timeframes: Use risk-based time windows (e.g., 1–3 months for low risk, 3–12 months for systemic).
• Data sources: Link CAPA outcomes to production metrics, complaint trends, environmental monitoring, and audit findings. Regulators expect cross-data comparisons.
• Methods: Statistical process control, trending, sampling plans, and targeted audits.
• Documented evidence and decision logic: Show why a CAPA passed or failed verification. If it fails, reopen and escalate quickly.
Governance and Accountability: From Tactical Owners to Executive Oversight
Strong CAPA governance requires three distinct layers:
• Local ownership: Process owners or line managers who implement actions and collect evidence.
• Quality oversight: A quality review board or CAPA review committee that assesses the quality of investigations and approves closure.
• Executive visibility: Monthly quality review dashboards presented to senior leadership with exception reporting (e.g., aging CAPAs, systemic trends, regulatory risk exposure). Leadership must tie CAPA KPIs to performance reviews and resource allocation.
Digital Tools and Data Integration: Turn CAPA into a Data-Driven Process
Manual CAPA tracking creates delays and data fragmentation. Leading manufacturers use integrated eQMS/eTMF systems or specialized CAPA modules to:
• Automate workflows and notifications to reduce overdue CAPAs.
• Link CAPAs to deviations, complaints, audit findings, change controls, and equipment maintenance records so investigations use broad data sets.
• Run dashboards and drill-down analytics for recurrence patterns and root cause clusters.
• Maintain an auditable trail that inspectors can follow. The FDA and other regulators now expect that organizations can demonstrate cross-source analysis and statistical methods where appropriate.
Risk-Based Prioritization and Resource Allocation
Not all CAPAs are equal. Use a risk matrix (severity x probability x detectability) to prioritize. Higher risk CAPAs require more rigorous root cause analysis, higher-level approvals, and longer verification windows. Allocate senior resources to high-risk investigations and reserve simpler, standardized templates for low-risk issues to prevent over-engineering.
Metrics to Watch That Signal Systemic Weakness
• Increasing recurrence rate despite steady CAPA volume – suggests weak root cause processes.
• Rising backlog and growing average closure time – indicates resource or governance bottlenecks.
• Low root cause quality scores – points to training or methodology gaps.
• Repeated regulatory observations referencing CAPA – the highest-impact signal of systemic failure.
Using Financial Metrics to Build Executive Support
Translate CAPA outcomes into CoPQ and ROI. Estimate the direct remediation cost per event (labor, rework, scrap) and indirect cost (lost sales, inspection response). Many organizations find CoPQ at 10–20% of sales for poor-quality heavy processes; even small percentage reductions can free significant capital. Use this financial case to justify investments in tooling, training, and dedicated CAPA teams.
Change Management: Training, Methods, and Cultural Moves That Improve CAPA Effectiveness
• Train investigators on robust RCA techniques: 5 Whys, Fishbone, Fault Tree Analysis, and evidence-based hypothesis testing.
• Score investigations using a standard rubric and give feedback.
• Reward prevention: include preventive CAPA metrics in performance dashboards.
• Encourage cross-functional investigation teams to improve the breadth and credibility of analyses.
Case Example Insights (What Studies Show)
Pilot programs that introduced structured CAPA methodology, governance, and pilot dashboards have reported dramatic reductions in repeats, from baseline ranges in the mid-teens to near-zero repeat rates in targeted pilots. These kinds of results reinforce that a combination of methods, governance, and monitoring can produce measurable improvements quickly.
How Regulators See CAPA: Immediate Compliance Risks
Regulators evaluate whether an organization compares data sources, uses statistical or trend analysis where appropriate, and documents effective verification. CAPA deficiencies remain a common inspection finding and a frequent cause of Form 483 observations and warning letters. Therefore, CAPA KPIs should be part of inspection readiness programs and mock inspections.
Practical Implementation Roadmap (12–18 Weeks)
Weeks 1–3: Baseline and design – collect current CAPA data, define KPI definitions, set targets, and risk tiers.
Weeks 4–8: Tooling and process updates – configure eQMS/CAPA module, standardize investigation templates, launch root-cause scoring rubric.
Weeks 9–12: Governance and pilot – create CAPA review board, pilot on critical product line, and measure target KPIs weekly.
Weeks 13–18: Scale and refine – roll out to other lines, implement training, embed KPIs in executive dashboards, and set continuous improvement cadence.
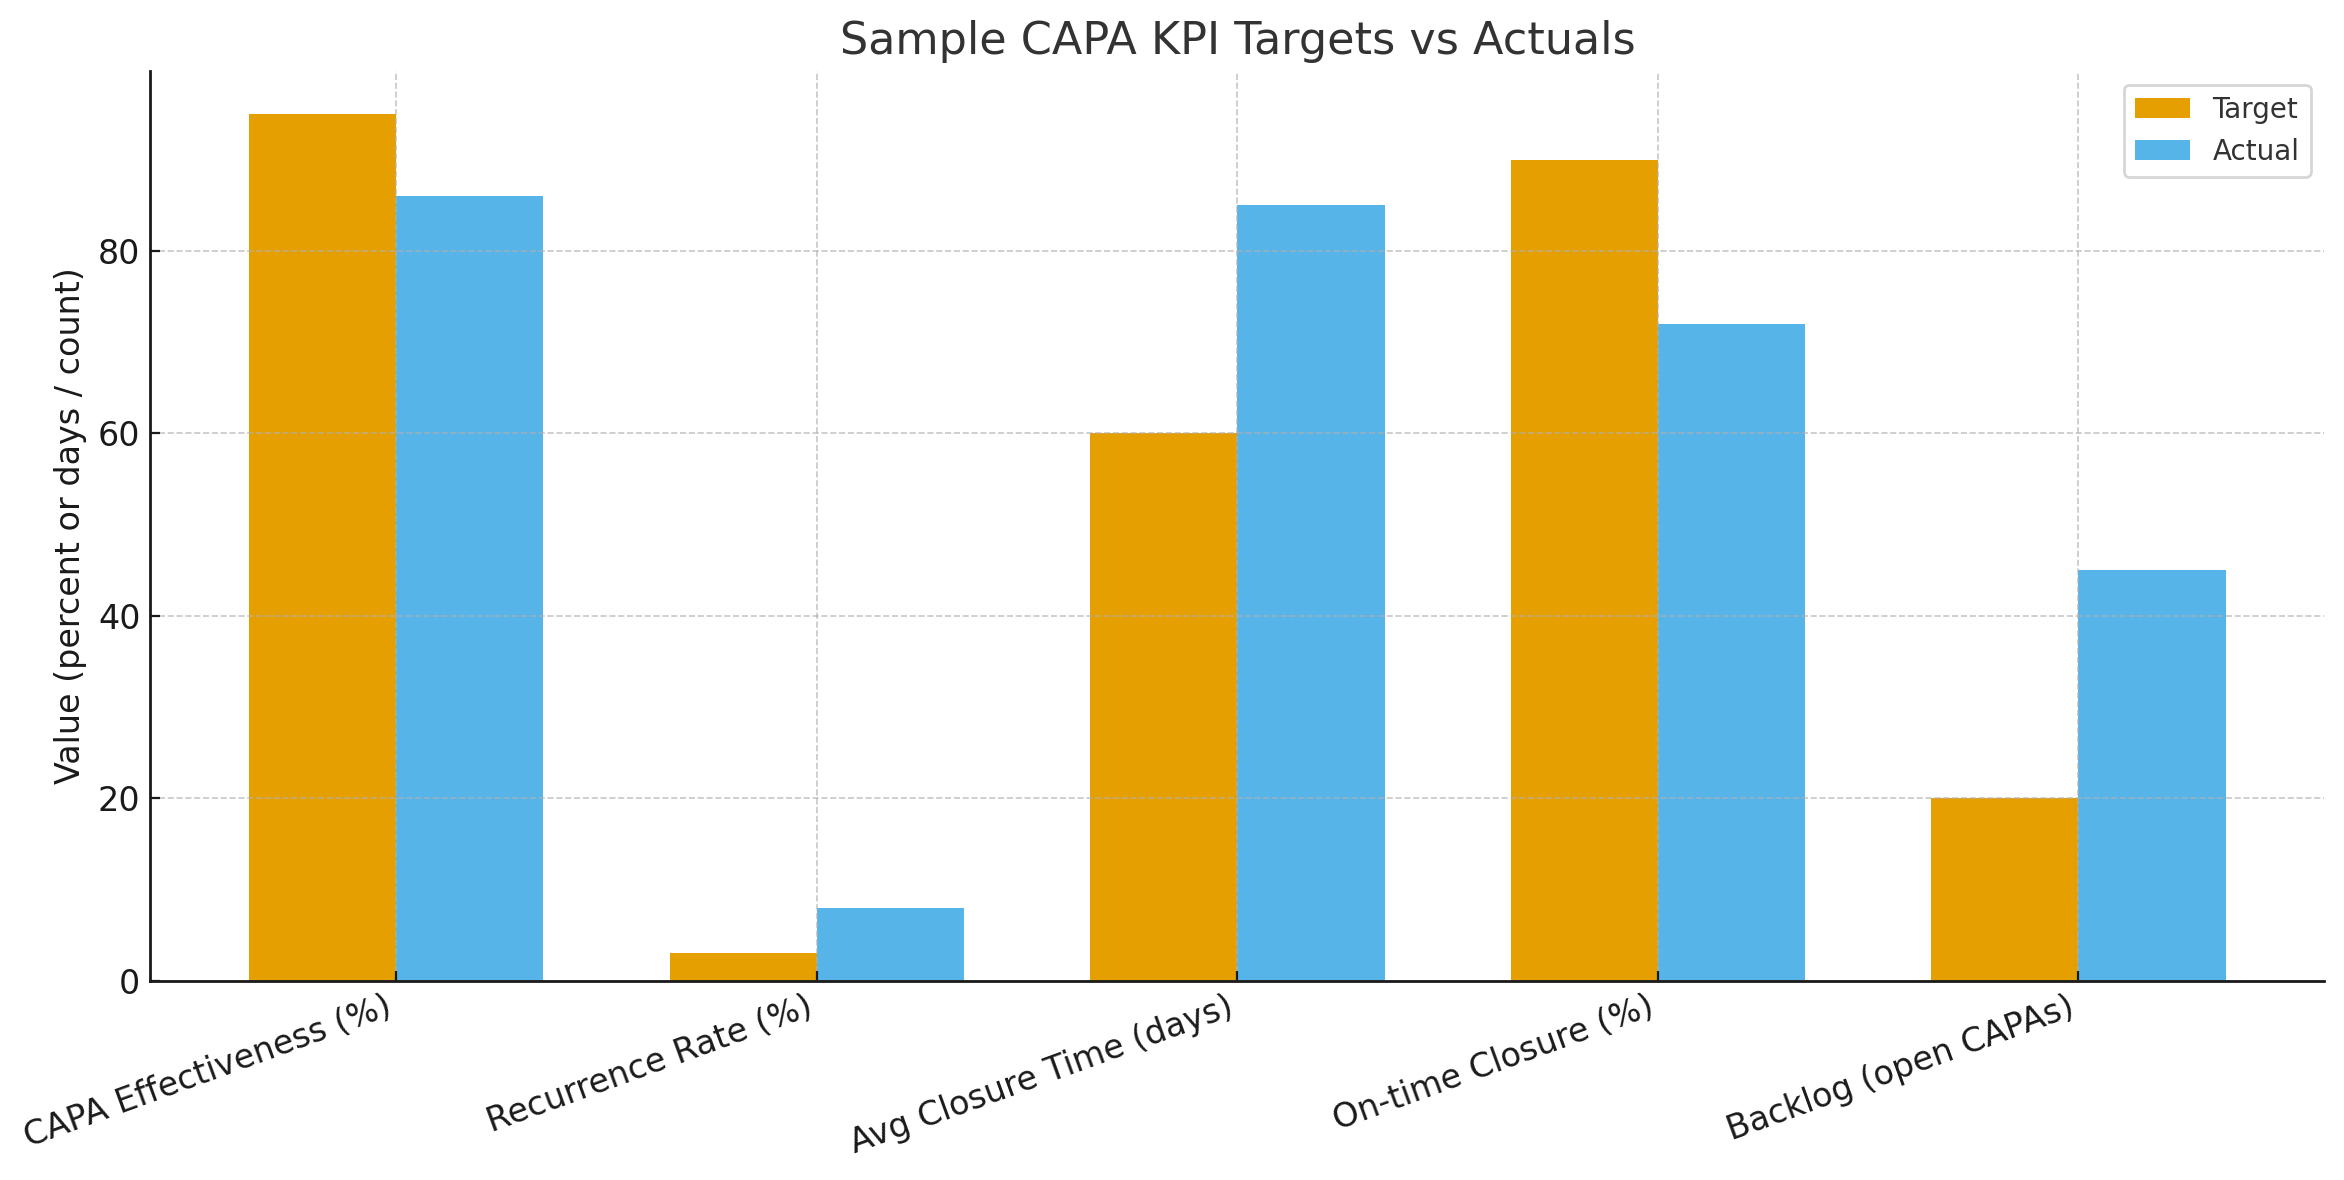
Sample KPI Dashboard and Chart
Here is a sample chart that contrasts typical CAPA targets and actuals (CAPA effectiveness, recurrence, average closure time, on-time closure, and backlog).
Interpreting the Dashboard: What to Do with the Signals
• Low effectiveness, high recurrence: Re-run root cause analysis with a multi-disciplinary team; escalate to quality leadership.
• Long average closure time with low backlog: Investigate complexity and redesign workflows for complex investigations (use project management techniques).
• High backlog with many overdue CAPAs: Add resources, remove low-value CAPAs, or standardize repetitive investigations to templates.
• High CoPQ linked to CAPA themes: Create targeted prevention programs.
Common Pitfalls and How to Avoid Them
Metrics that are easy to game – e.g., counting “closed” CAPAs rather than verified effective ones. Solution: define and enforce evidence-based closure.
Short verification windows that encourage superficial checks.
Solution: Use risk-based verification windows and objective success criteria.
Poor data linkage – CAPAs tracked in spreadsheets disjoint from production or complaint data. Solution: integrate data sources into eQMS or BI systems.
Lack of leadership attention – CAPA becomes an operational task, not a strategic priority.
Solution: include CAPA KPIs in executive scorecards.
Advanced Analytics: Moving From Descriptive to Predictive CAPA Management
With integrated data, teams can apply analytics to identify early warning patterns before large-scale problems emerge. Examples include:
• Trend detection across batches and sites that suggests systemic process drift.
• Root cause clustering using NLP on CAPA descriptions to reveal hidden correlations.
• Predictive backlog modeling to forecast resource needs. These analytics amplify the value of CAPA by turning it into a proactive quality tool.
Measuring Success: Five Signals That Your CAPA Program Works
1- Sustained downward trend in recurrence rate.
2- CAPA effectiveness consistently >90% in high-risk categories.
3- Reduced the cost of poor quality in key product lines.
4- Fewer CAPA-related inspection findings.
5- Faster, evidence-based decision cycles and fewer overdue CAPAs.
Summary and Practical Checklist
• Define a focused KPI set: effectiveness rate, recurrence, average closure time, on-time closure, backlog, root cause quality, and CoPQ.
• Use risk-based verification plans with clear success criteria and data sources.
• Integrate CAPA with other quality data in an eQMS and analytics platform.
• Implement three-layer governance: local owners, quality oversight, and executive visibility.
• Translate CAPA outcomes into financial metrics to secure investment in tooling and training.
Most frequently asked questions related to the subject.
Q: What is an acceptable CAPA effectiveness rate?
A: Organizations commonly target >90% effectiveness for verified CAPAs; lower rates require root cause and verification method review.
Q: How long should a CAPA remain open?
A: There is no single regulatory timeline. Use risk-based windows; simple CAPAs may close in days to weeks, complex systemic CAPAs may require months and prolonged verification.
Q: How do I measure recurrence?
A: Define recurrence logic (same failure mode, same product or process), select a time window (6–12 months is common), and track reappearance of the defect or signal after CAPA closure.
Q: How much should we invest in CAPA tools?
A: Build a business case by estimating the current CoPQ and projecting savings from reduced recurrence and remediation. CoPQ estimates in many manufacturing contexts are a material percent of revenue.
Q: Are CAPA issues a regulatory risk?
A: Yes. CAPA deficiencies are commonly cited in inspections and linked directly to Form 483s and warning letters. Regulators expect cross-data analysis and statistical trend methods when appropriate.
If you want to explore these compliance topics in more depth, visit the Atlas Compliance blog for detailed insights, real-world case studies, and up-to-date regulatory analysis.