Regulatory intelligence, when tightly integrated with a modern quality ecosystem (digital QMS, MES, MCP, CAPA analytics, and AI), can materially reduce repeated FDA Form 483 observations by turning reactive fixes into systemic prevention. Regulatory intelligence helps teams anticipate shifting expectations, prioritize root causes, close CAPA loops, and automate evidence trails, all of which reduce the likelihood that inspectors will encounter the same nonconformance twice. Below you will find an advanced, practical, and execution-focused guide for life-science and pharma manufacturing leaders on how to design programs that turn regulatory signals into measurable reductions in repeat 483s, with current data, implementation pathways, governance controls, and KPIs.
Introduction- Why repeated 483 observations matter and why prevention must change
Repeated FDA Form 483 observations are both expensive and dangerous, as they can drain bench-to-market timelines, erode stakeholder trust, trigger deeper inspections, and often escalate to warning letters or enforcement actions when left unresolved. Beyond penalties, repeat observations reveal weak systems thinking: superficial CAPA, poor knowledge management, and poor linkage between inspection outcomes and operational controls. Data released by inspection authorities show that inspectional observations across key program areas remain significant year-on-year, and regulators provide downloadable datasets to track where citations concentrate. Acting on that data proactively, rather than retroactively, is the single most reliable way to reduce recurrence.
What is regulatory intelligence (RI), and how is it different from “regulatory monitoring” clear definitions
Regulatory intelligence (RI) is the structured practice of collecting, contextualizing, and operationalizing regulatory signals to influence business decisions. Regulatory monitoring gathers raw rules and announcements; RI interprets those signals, maps them to affected systems (QMS, manufacturing control, supplier control), and prescribes prioritised business actions. In practice, RI blends signal ingestion (regulatory feeds, inspection reports, warning letters), semantic analysis (trend-detection, clustering of observations), and prescriptive workflows (policy updates, training, CAPA triggers). The result is faster, risk-ranked decisions rather than scattered compliance firefighting.
How RI directly reduces repeated 483s, the mechanism chain
- Early signal detection and pattern recognition: RI platforms aggregate inspection observations across jurisdictions and product types. When repeat themes appear, e.g., data integrity, cleaning validation, or stability protocol weaknesses, RI highlights them. Leadership can then prioritize systemic remediation rather than repeating tactical fixes.
- Root cause prioritization and CAPA quality: RI helps differentiate one-off execution errors from systemic process design flaws. When CAPA workstreams are prioritized based on inspection trends and regulatory direction, they target root causes with measurable controls, reducing the likelihood of the same observation repeating.
- Operationalizing requirements into MCP and QMS: RI translates regulatory expectations into machine-actionable checks inside Manufacturing Control Platforms (MCPs), digital QMS, and MES, for example, mandatory sampling frequencies, electronic record retention rules, or audit trail requirements. This eliminates human interpretation gaps that create repeat observations.
- Evidence readiness and audit trail automation: RI-driven templates and checklists integrated into MCPs standardize the evidence package for every corrective action and process change. When inspectors request proof, teams can demonstrate closed-loop remediation rather than ad-hoc paperwork.
- Continuous learning and prevention loop: RI provides a feedback stream from inspections and public regulatory actions into continuous improvement cycles. Over time, this shifts organizations from reactive responses to anticipatory compliance.
Recent trends and current data, what the numbers are telling us
Regulatory authorities publish their inspection observations and datasets, which makes trend analysis possible. The official inspection observation datasets show the distribution of observations across product areas and system categories, demonstrating persistent concentration in certain domains (for example, quality systems, laboratory controls, and production). This structured data enables organizations to benchmark their exposure and map high-risk observation clusters to their operations.
Industry practitioners and consulting analyses also report measurable benefits from digital transformation programs: when digital QMS or integrated MES/MCP solutions are used with targeted remediation programs, companies report reductions in repeat citations for the same issue in the range of about 30–50% in post-implementation measurements. These figures reflect combined benefits from improved evidence management, automated controls, and better CAPA closure metrics. Note that this is an industry-observed range rather than a uniform guarantee; outcomes depend on scope, governance, and the depth of integration between RI and operational systems.
A recent high-profile regulatory enforcement example shows the stakes. A manufacturing organization that received inspectional observations escalated to a public enforcement action; the case highlighted weaknesses in manufacturing controls and quality systems. That real-world example underscores why leaders must move beyond single-item fixes and toward integrated RI + MCP strategies to prevent recurrence.
Design principles for an RI program that reduces repeat 483s, strategy, and structure
- Connect RI to outcomes, not reports. Define clear business outcomes such as “reduce repeat observations in lab control by X% in 12 months” or “close CAPA backlog older than Y days.” Tie RI KPIs to those outcomes.
- Map regulatory signals to systems. For each common 483 category (e.g., data integrity, CAPA documentation, equipment cleaning), map which operational systems and roles must change: MCP workflows, LIMS, QMS modules, operator training, vendor agreements.
- Prioritize via risk and impact. Use inspection frequency, product criticality, and patient-safety impact to rank remediation work. Not every observation requires enterprise spend; RI should surface what matters.
- Instrument the factory: convert rules into checks. The most sustainable prevention is converting policy into software-enforced checks inside the MCP. If a procedure requires three signatures before release, the MCP should enforce that sequence and log exceptions with reason codes.
- Make CAPA a data pipeline. Treat CAPA actions as structured data, with fields for root cause category, risk score, assigned owner, remediation metrics, and evidence upload. This allows analytics to detect stalled CAPAs and recurring themes.
- Governance and escalation. Define a governance board that includes RA, QA, manufacturing, and IT. That board reviews RI alerts, approves high-impact remediations, and measures ROI.
Operational playbook, step-by-step to implement RI that prevents repetition
Step 1: Baseline current exposure. Pull the last three fiscal years of inspection observations and classify them by system (quality, lab, production), root cause, and recurrence. Use the agency’s published datasets as the authoritative baseline.
Step 2: Build a prioritized remediation backlog. Convert observation clusters to projects. For example, if data integrity appears in lab control and electronic batch records, create two projects: EBR enforcement and lab data integrity controls, each with timelines and owners.
Step 3: Define machine-enforceable controls. For every remediation, ask: Can the MCP or QMS enforce this? If yes, design the technical requirement; if not, require evidence templates, checklists, or training.
Step 4: Integrate RI into change control. Make regulatory trend analysis a standard input in change control boards. Any change affecting controlled documents, batch procedures, or software must reference relevant RI signals.
Step 5: Automate CAPA evidence capture. Configure the QMS/MCP to attach required evidence to CAPA tickets automatically (logs, test results, signatures). This reduces manual back-and-forth and improves closure quality.
Step 6: Monitor and measure. Use dashboards that combine RI signals, CAPA metrics, and inspection outcomes. Track repeat observation rate by category, CAPA closure quality score, and median time to remediation.
Technology enabling the program, what to select, and why
- Regulatory intelligence engine. Select a solution that offers semantic search across inspection reports, warning letters, and guidance documents, and can map themes into your taxonomy. Prefer tools that provide normalized tags (e.g., “data integrity”, “sterilization”) and trend-analysis features.
- Digital QMS with CAPA / CAPA analytics. The QMS must support structured CAPA fields, automated evidence linking, and workflow enforcement. CAPA analytics should detect similar issues across time and sites.
- Manufacturing Control Platform (MCP) and MES. The MCP should enforce process steps, capture electronic batch records, and provide immutable audit trails. Where possible, integrate MCP events into CAPA triggers (e.g., out-of-spec events that auto-open an investigation).
- LIMS and analytical systems with secure audit trails. Lab systems must implement ALCOA+ principles (Attributable, Legible, Contemporaneous, Original, Accurate, and the plus elements) and integrate with the QMS to flag deviations for investigation.
- Data fabric and analytics layer. A centralized analytics layer harmonizes events from QMS, MCP, LIMS, and RI, enabling root-cause detection and correlation across systems.
- Automation & AI: use AI for prioritization, not final decisions. Machine learning can cluster observations, predict likely recurrence, and prioritize CAPAs by risk, but human governance must validate and approve regulatory conclusions.
Governance and validation, controls to keep RI integration inspection-ready and trustworthy
• Documented decision logic: for each RI-driven control added to an MCP, capture the regulatory rationale, the decision path, and the approval by RA and QA.
• Validation of software enforcement: Any MCP changes that affect controlled processes must follow established validation practices (user requirements, risk assessment, verification, and documented testing).
• Data integrity controls: Ensure audit trails, user access controls, and backup policies are in place for all digital systems. This prevents data integrity observations that commonly recur.
• Cross-functional signoff: Regulatory, QA, manufacturing, and IT must sign off on high-impact RI-driven changes and be available during inspections to explain the linkage between RI signals and implemented controls.
Measuring success, KPIs that prove RI reduces repeats
- Repeat the 483 rate by category (monthly, quarterly). Measure the count of inspection observations that reappear within 24 months as a percentage of total observations.
- CAPA quality score. Define objective CAPA quality criteria (thorough root cause analysis, robust corrective actions, preventive steps, verification). Track the percentage of CAPAs meeting the quality threshold.
- Time-to-closure for high-risk CAPAs. Faster resolution reduces risk exposure; complement speed with quality metrics.
- Evidence completeness at inspection. Percentage of inspection requests satisfied within X days with complete evidence.
- Number of regulatory “surprises” (e.g., unanticipated findings) year-on-year. A decline suggests better anticipatory control.
Case examples and practical outcomes: what leaders can expect
• A mid-sized manufacturing site used a combined RI and digital QMS approach to tackle recurring lab control observations. By mapping inspection themes to LIMS controls, enforcing sampling plans inside the MCP, and automating CAPA evidence capture, the site reported a marked reduction in repeated lab-related observations and faster responses during follow-up inspections. The industry has reported reductions in repeat citations after digital QMS/MES adoption in the 30–50% range in observable measures.
• Where gaps remain in governance or the MCP does not fully enforce controls, the same investments deliver less return. The lesson is clear: technology alone is not the solution; RI must be connected to validated processes, governance, and people.
Common pitfalls and how to avoid them
- Treating RI as a feed, not a decision system. If RI is only emailed to busy staff, it will not change outcomes. Assign owners and require documented actions from RI signals.
- Over-automation without validation. Automating a control in the MCP without proper validation or without understanding human exceptions can create new inspection risks.
- Failing to prioritize. Not all observations carry equal risk. Use a risk-based approach to invest where the patient safety and business impact are highest.
- Siloed implementation. RI insights must touch QA, RA, operations, and IT. Siloes destroy the loop between detection and prevention.
- Weak CAPA discipline. Poor root-cause analysis or CAPA documentation still produces repeat observations despite good RI.
Implementation timeline and resource planning, a pragmatic schedule
Month 0–3: Baseline, taxonomy, and quick wins. Download inspection datasets, map top recurring observations, and launch 3–5 quick-win projects (e.g., enforce signature sequencing, standardize evidence templates).
Month 3–9: Tactical automation and CAPA reform. Configure QMS to structure CAPA fields, integrate with MCP for evidence capture, and deploy initial RI dashboards.
Month 9–18: Deep integration. Extend MCP enforcement to complex controls (e.g., cleaning SOP enforcement), validate changes, and measure early KPI shifts.
Month 18+: Continuous improvement. Scale the program to other sites, refine predictive models for repeat risk, and institutionalize RI into product lifecycle governance.
Budget considerations and ROI logic
Investment areas: RI platform licensing, integrations (MCP, QMS, LIMS), validation and change control, training, and governance. ROI accrues from fewer inspection disruptions, reduced remediation costs, faster product approvals, and lower business risk. Practical modeling should estimate the cost per repeat 483 (including inspection response, CAPA labor, lost production, and potential recalls), then calculate the reduction impact; industry reports suggest tangible savings when repeat observation rates fall by tens of percent.
Security, privacy, and ethical considerations when using RI and AI
• Protect confidential regulatory communications and inspection data with strong access controls.
• Ensure AI-based prioritization models are auditable and interpretable; do not rely on opaque “black-box” outputs to decide remediation priorities without human oversight.
• Maintain data minimization and encryption for cross-border intelligence feeds.
A sample dashboard, what metrics to show to executives
Provide an executive dashboard with: repeat 483 rate by category, CAPA quality score, median time-to-closure for high-risk CAPAs, number of RI-driven mitigations in flight, and projected reduction in repeat risk for the next 12 months. Visual signals should link each metric to operational owners and due dates.
Implementation checklist, a compact action list leaders can use now.
• Download and analyze your inspection observation history (3-year window).
• Establish an RI governance committee with RA, QA, Ops, and IT.
• Select an RI tool with semantic analytics and trend detection.
• Map the top 10 recurring observations to MCP/QMS controls.
• Configure QMS to force structured CAPA evidence attachments.
• Validate MCP changes and record the regulatory rationale.
• Run monthly RI-to-CAPA reviews and measure KPIs.
Illustration: an evidence-driven reduction
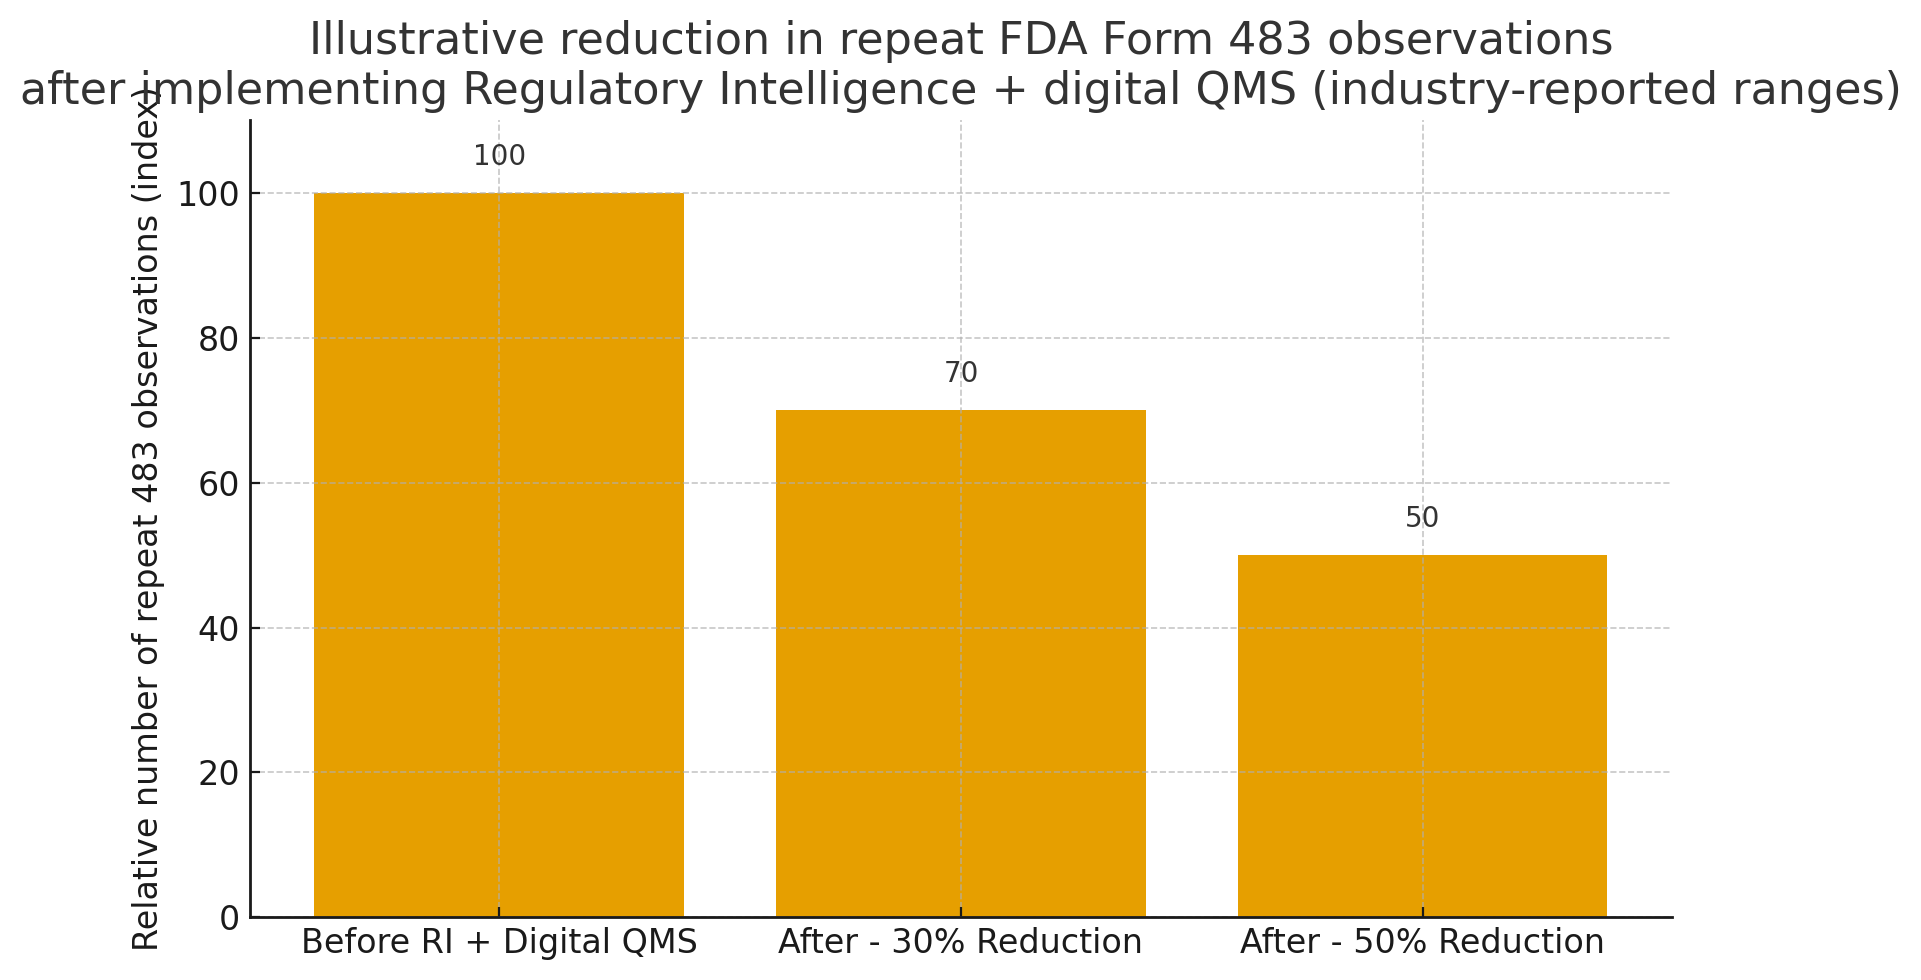
(To show the kind of outcomes companies report, an illustrative chart has been provided above: it models a baseline index of repeat observations as 100 and demonstrates how industry-reported reductions of 30–50% after RI + digital QMS implementations translate into lower repeat risk. These are representative benchmarks, not guaranteed outcomes.)
Conclusion: What pharma leaders must do next
Regulatory intelligence is not a compliance luxury; it is an operational necessity for modern pharmaceutical manufacturing. When RI is joined to validated MCP controls, a structured QMS, and disciplined CAPA governance, it turns the problem of repeat 483 observations from a compliance liability into a measurable improvement program. Leaders should prioritize RI not as a reporting tool, but as a decision engine: map inspection data to MCP-enforced controls, make CAPA evidence machine-readable, validate every automation, and measure outcomes with repeat-observation KPIs. The combination of RI insight, digital enforcement, and cross-functional governance offers the most credible path to reduce repeated FDA Form 483 observations sustainably.
Most frequently asked questions related to the subject.
Q: Will regulatory intelligence guarantee zero repeat 483s?
A: No. RI reduces risk and recurrence by improving anticipation and remediation, but it cannot eliminate human error or unforeseeable inspection focus shifts. It raises the bar and reduces frequency meaningfully when implemented with validated controls.
Q: How long before I see measurable reductions?
A: Many organizations observe early improvements in CAPA quality and evidence completeness within 6–9 months; larger reductions in repeat observations are often measurable in 12–24 months, depending on scope.
Q: What percent reduction can I expect?
A: Industry reports indicate reductions in repeat citations in the broad range of about 30–50% after combined RI and digital QMS/MES programs, but results vary by organization and maturity.
Q: What is the single highest-impact change?
A: Converting inspection expectations into machine-enforced controls inside the MCP (with validation and governance) typically delivers the biggest step-change.
Q: Should AI make CAPA decisions?
A: Use AI for prioritization and clustering; keep root-cause confirmation and remediation decisions under human QA/RA governance.
Platforms like Atlas Compliance turn regulatory data into actionable intelligence. With real-time FDA insights, AI-driven analytics, and automated CAPA tracking, Atlas helps pharma teams identify repeat risks early, strengthen compliance, and stay inspection-ready.